Global Shipping Trade Review
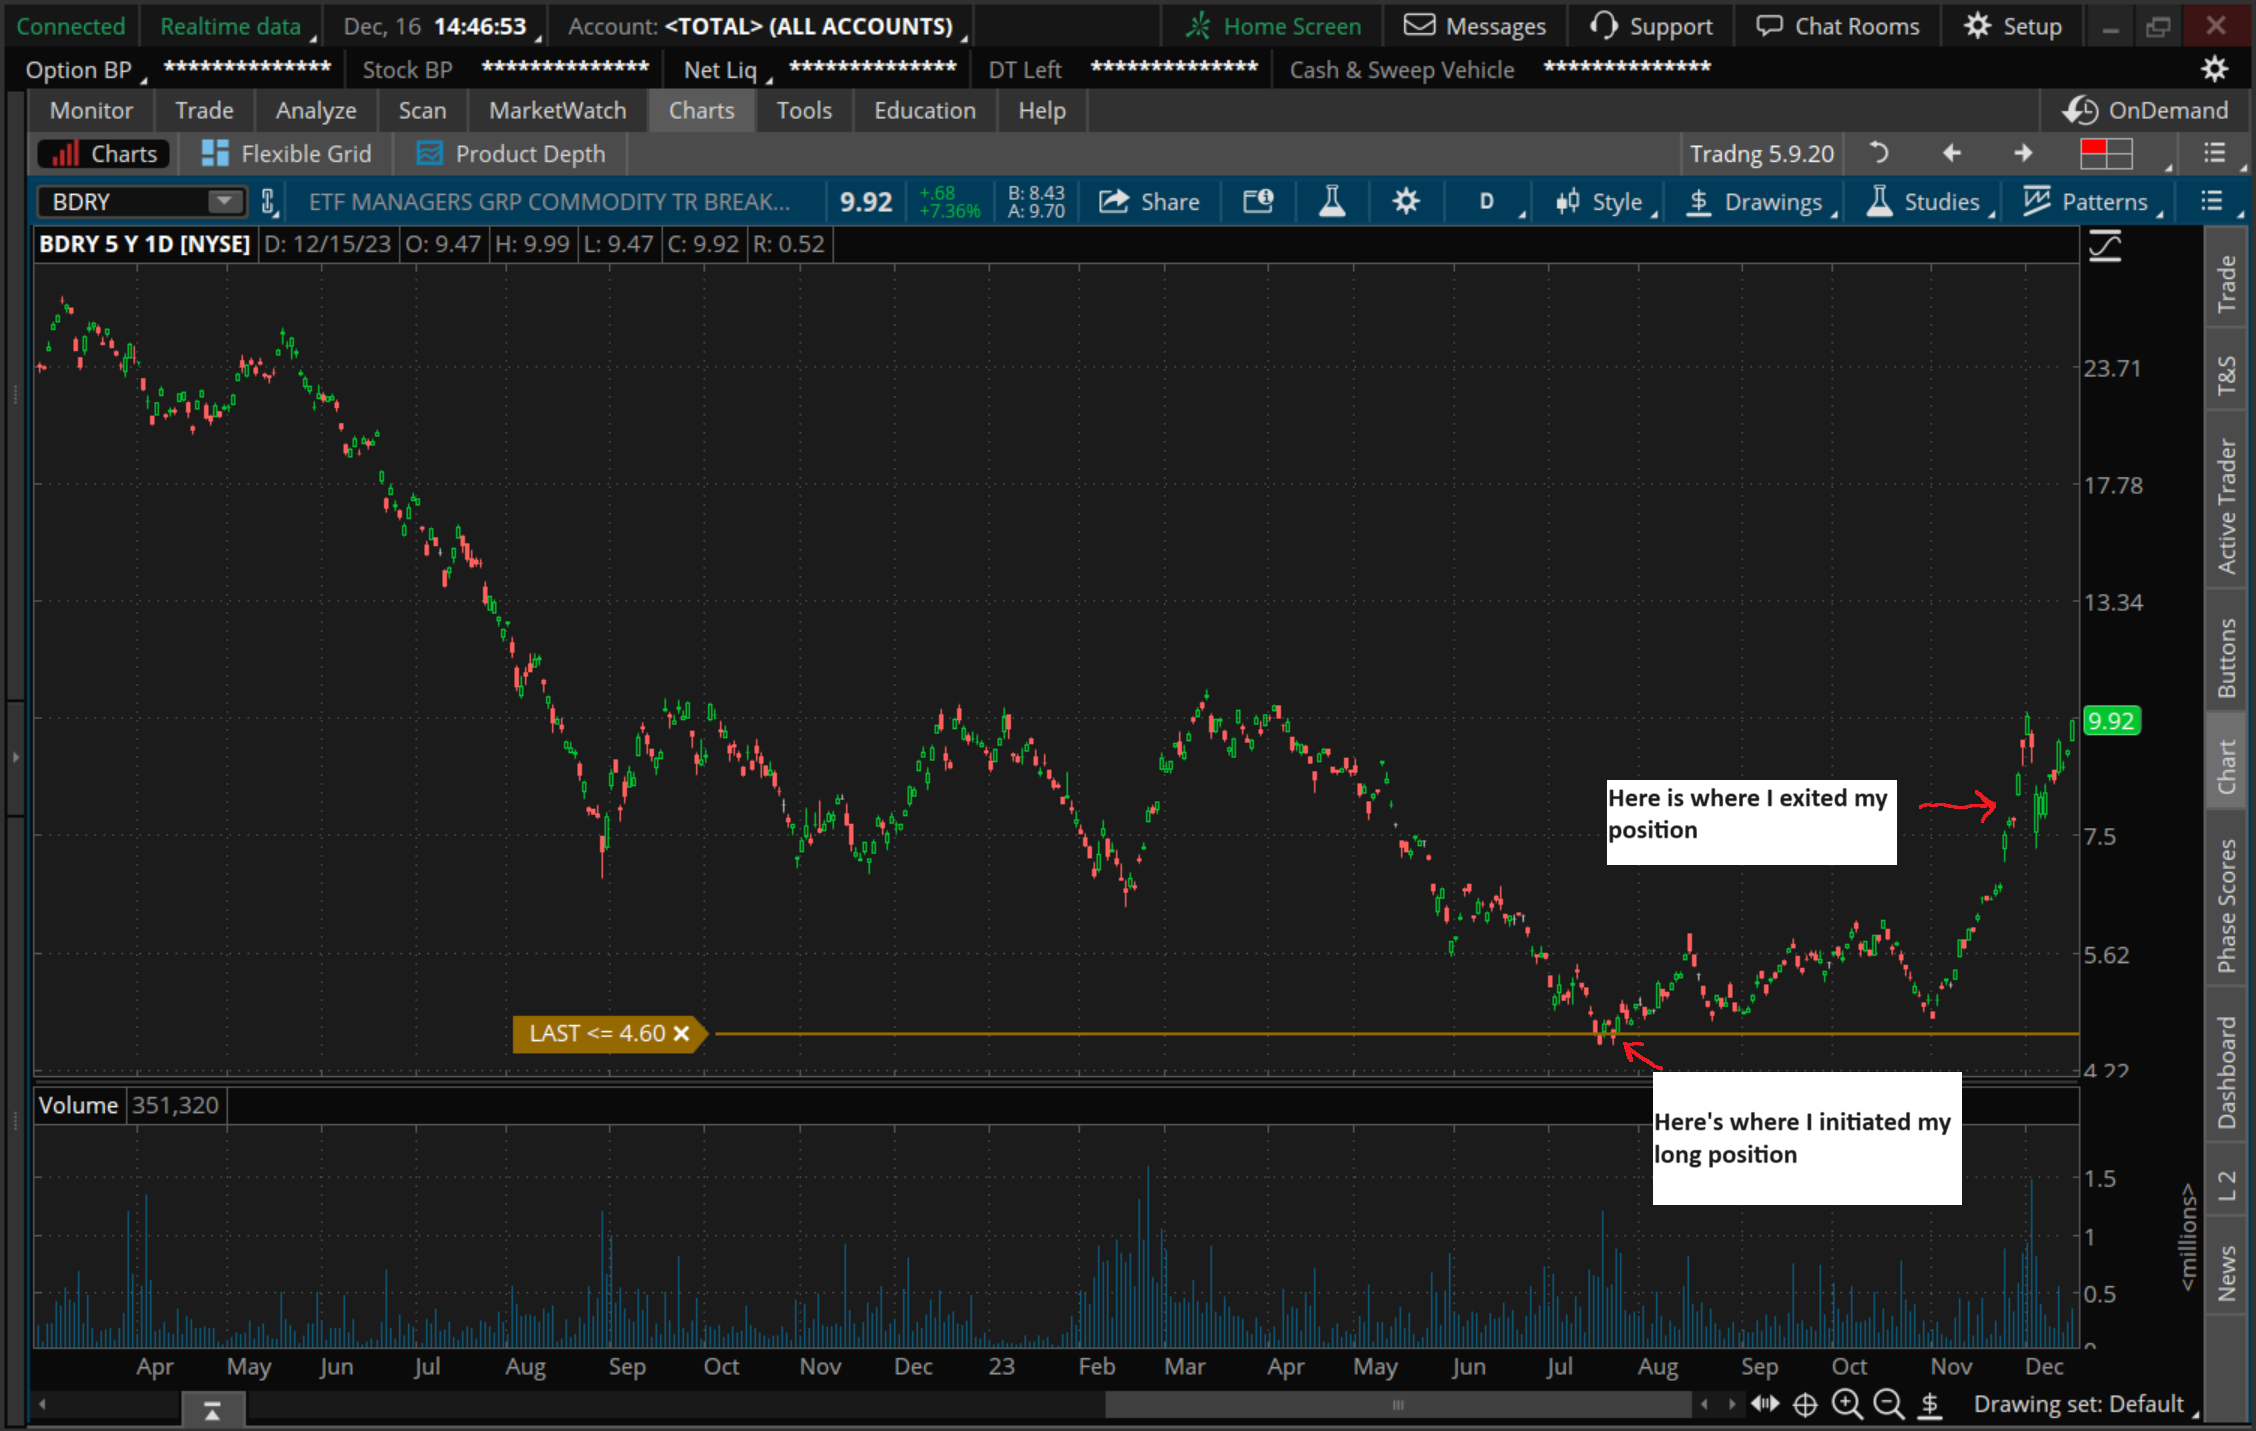
I recently made a trade in $BDRY a global shipping rates ETF, betting that shipping rates would rise from retesting the lows of 2020. Please use this chart as reference.
The global Shipping industry has been something I’ve been following and trading since 2020. 90% of the world's goods are still moved by sea, so this is a very important industry to follow. This industry can be sensitive to changes in business activity, geopolitical events, and climate to name a few. Being in tune with the state of global shipping can give you a look into the health of the global economy and sometimes help you predict where profits are going for certain industries. Shipping costs affect the price of goods, which depending on the direction of prices, consumers will be buying more or buying less, which affects corporate profits.
You may not know, but at the start of the pandemic the shipping industry went so bad that it was more profitable for companies to scrap their ships than to maintain the ships with little to no revenue. COVID at the very beginning put a halt to most business activity globally for some time. But once economies began reopening demand for goods came back and stronger than ever. I was able to catch some good trades in marine shipping stocks on the rebound. I regularly check in on the state of global shipping.
Trade Setup
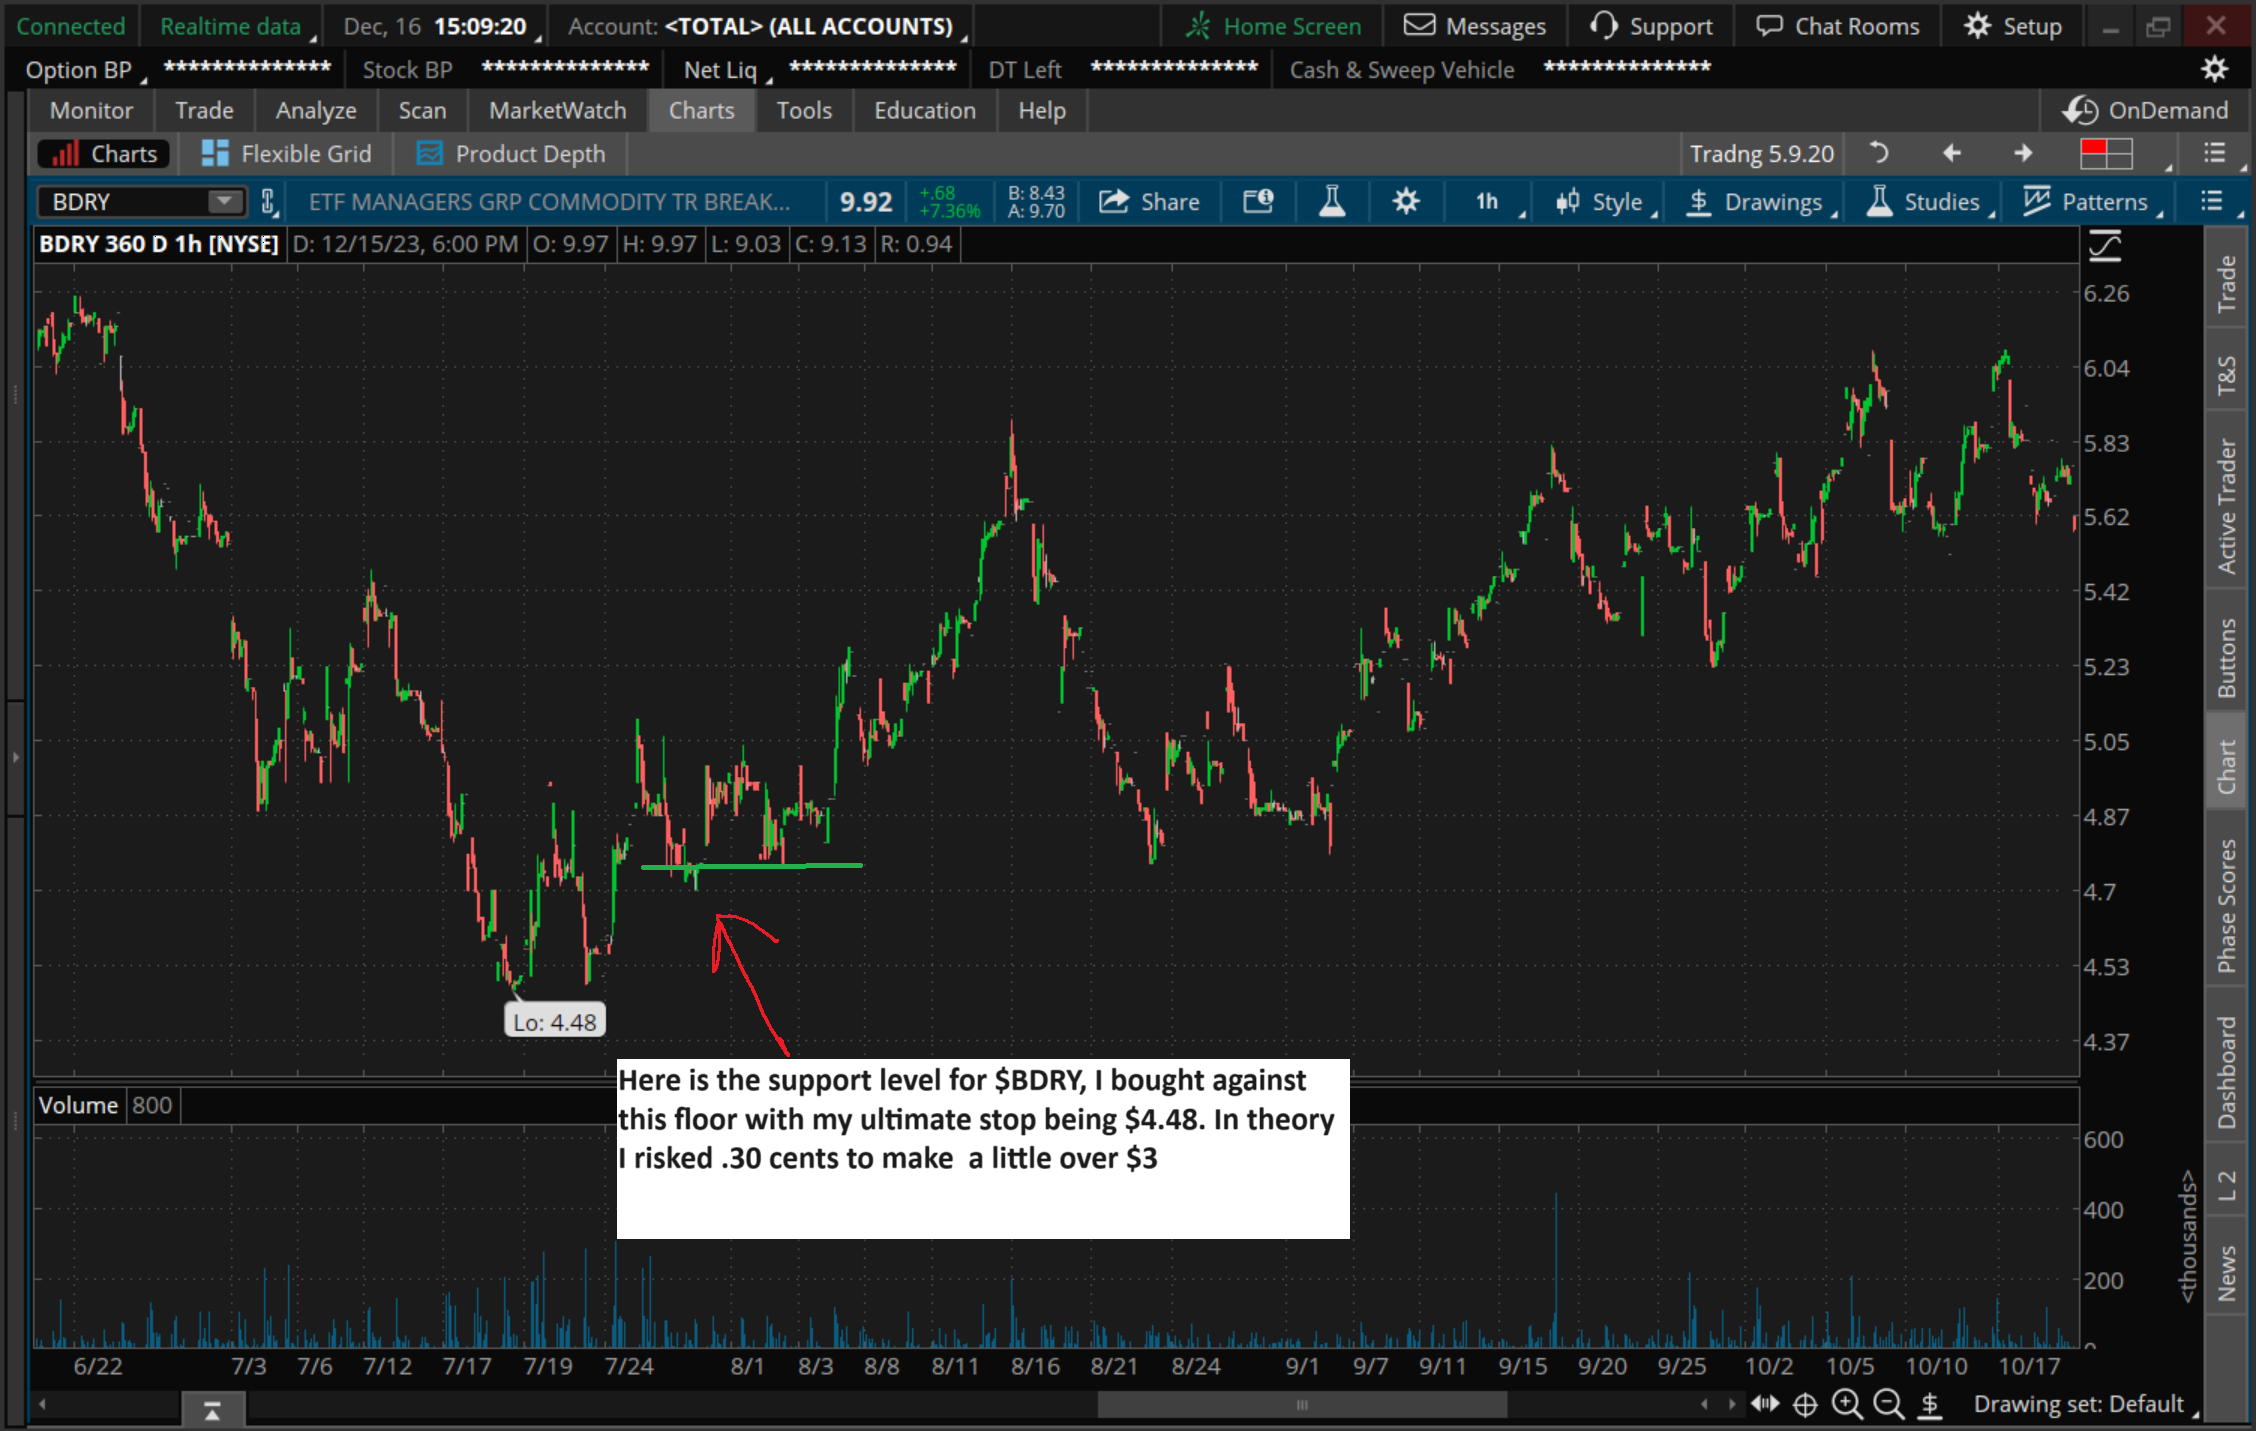
Back in August, I was doing my usual research into the shipping industry, and I noticed $BDRY a global shipping rates ETF, meaning this ETF tracks the prices of a variety of shipping rates globally, was at 2020 lows. I saw this as an opportunity for a low-risk high reward trade. With BDRY forming a support level at 4.70c on the hourly chart, I took it as an opportunity to get in.
Thesis:
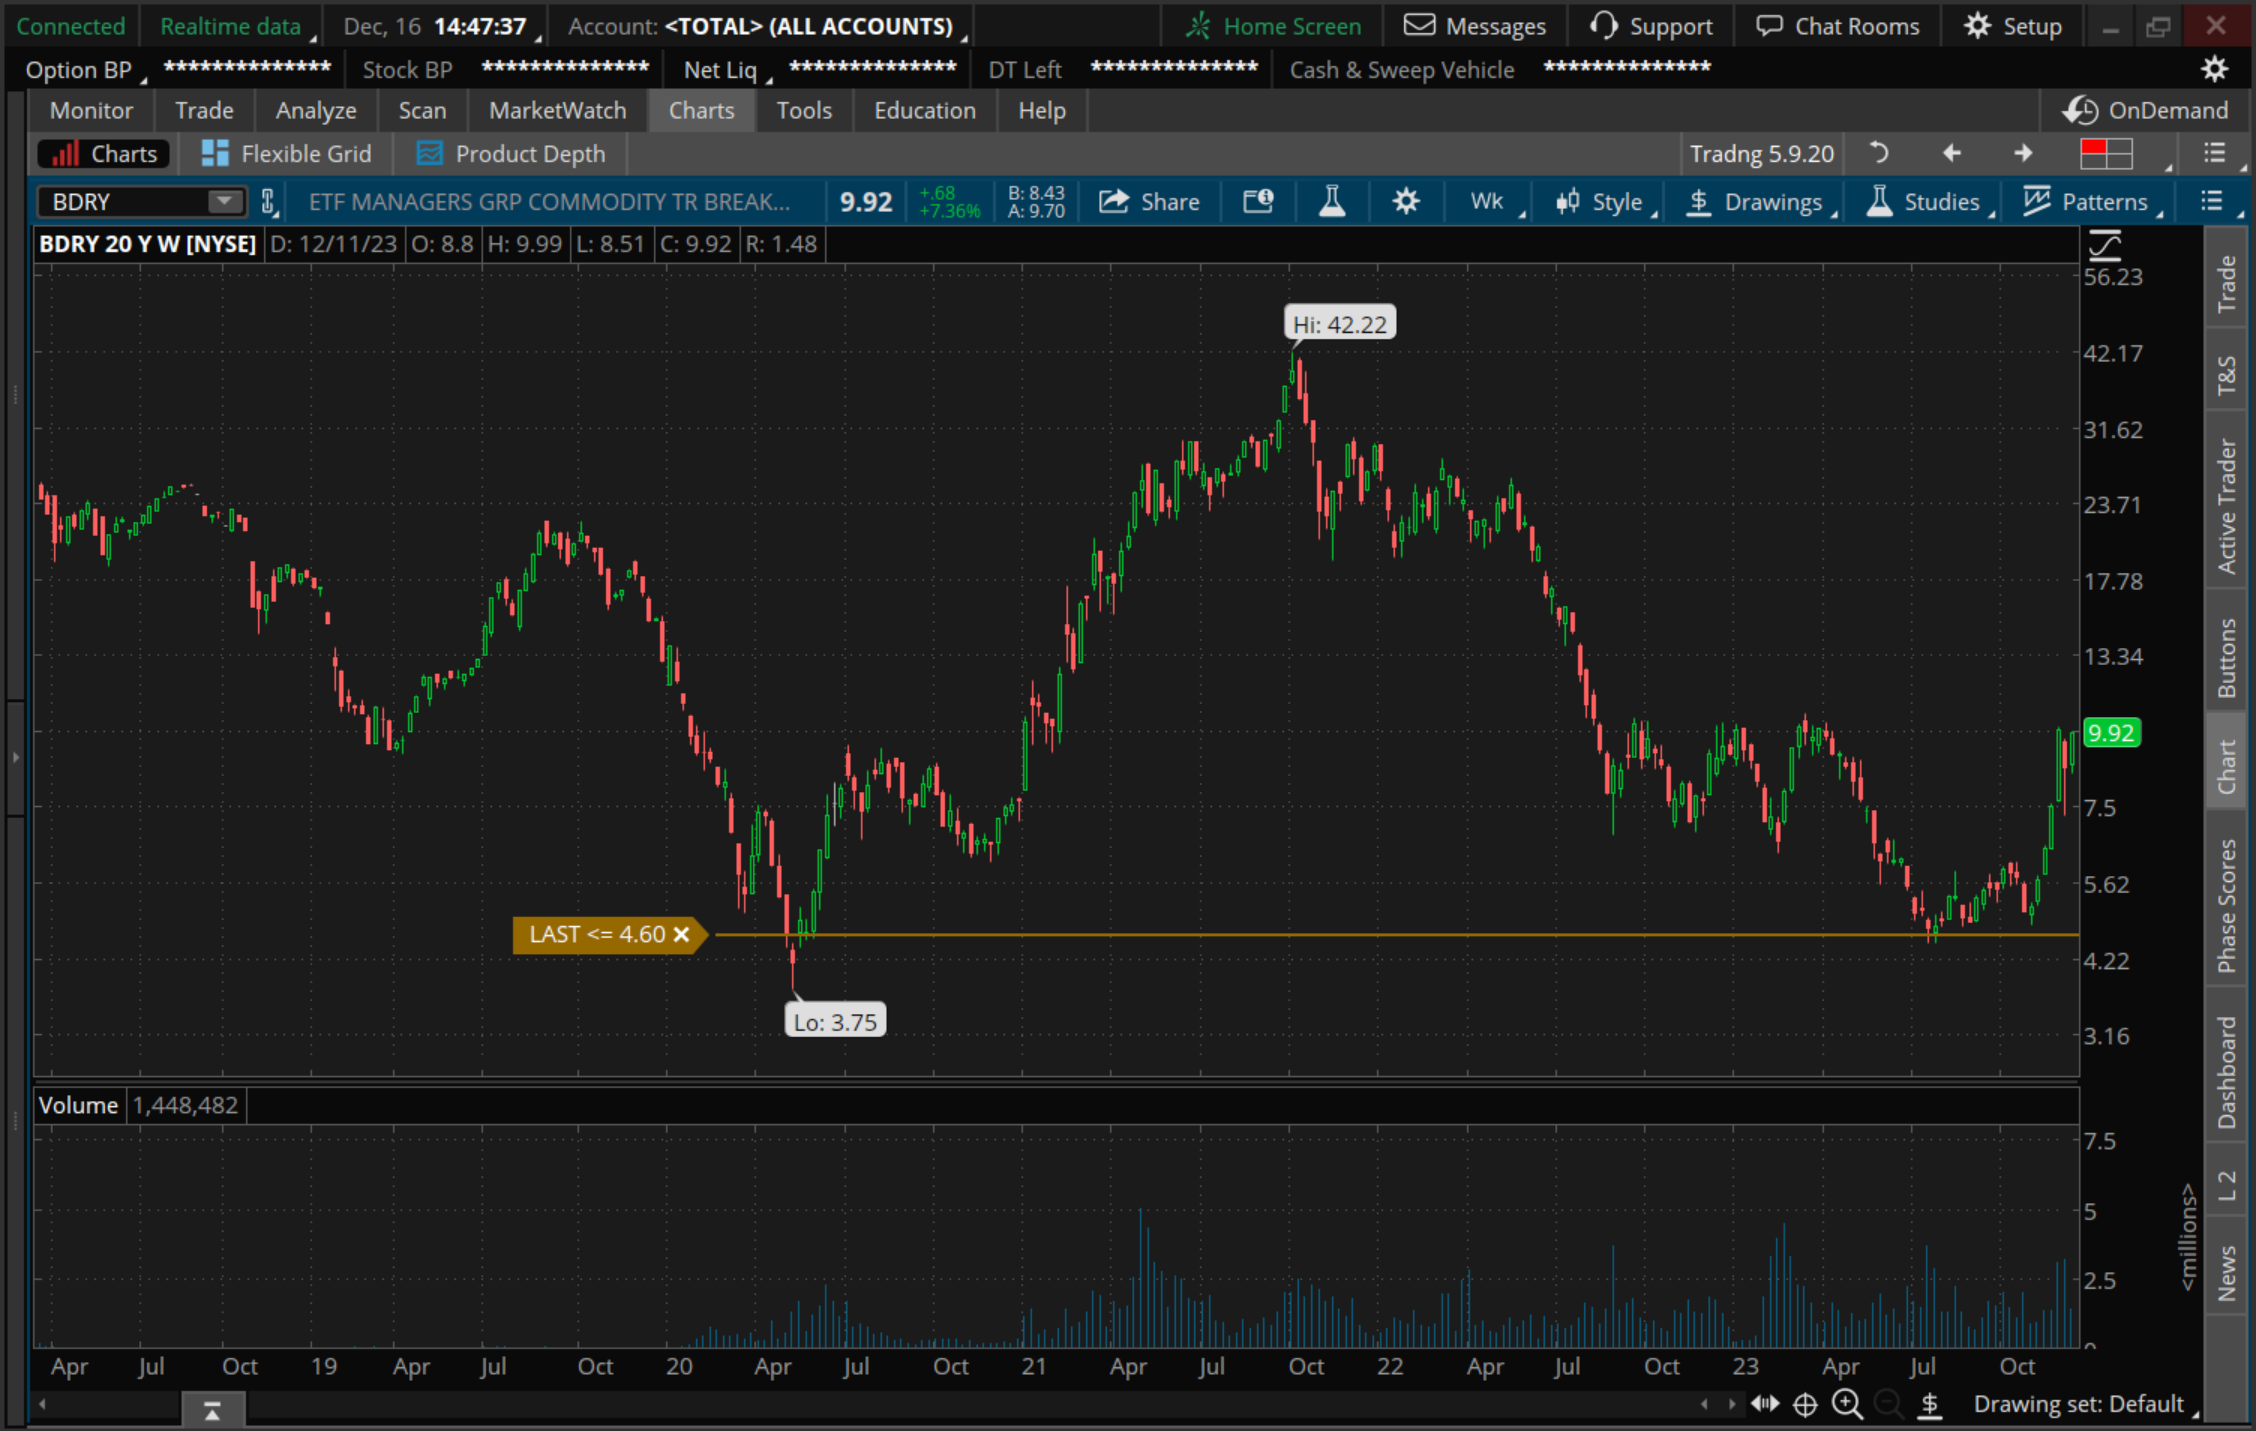
With $BDRY near the lows of 2020, I felt that the ETF was oversold. Back in 2020 at a similar price point global business activity came to a near halt, of course we have some challenges in the global economy, but nothing near COVID-19 lockdowns. The chart below is a weekly chart on $BDRY dating back to 2019. Notice how we weren’t to far from 2020 lows, but nowhere near the economic state of 2020.
Shipping rates are usually driven by the expected demand for the global economy. When major economies like US and China are expected to slow, investors begin to sell off their holdings in relevant commodities and shipping companies for example because they are anticipating a potential slowdown in activity.
Back in August, there were a lot of headlines around China having economic issues as well as potentially higher for longer interest rates by the Fed. Both scenarios’ points to a slowdown in shipping activity. I personally felt that as long as the US consumer continues to spend, the economy would navigate fine. I understand China’s economy has its issues, but sometimes the media is talking economic collapse, and I feel that sentiment is overblown. On the flipside, of course there are challenges, but the economy seems to be navigating ok. If all things remained the same, I didn’t see any major economic crises coming.
My personal view, economic data was weakening in the US and China with its challenges wasn’t facing an economic collapse. With $BDRY prices so low all I needed was China to maintain its status quo economically and the US to continue to trend with weakening economic data and the Fed will feel more comfortable starting its rate lowering process. The Fed raising interest rates has definitely put a damper on the economy and has slowed global trade. With interest rates going down we could expect global business activity to rebound, which in turn would lead to more demand for shipping goods worldwide. In this trade I sat through all the pullbacks, the stock eventually broke out and hit $10, on the pullback I didn’t want to give back all my profits, so I sold at $7.80. Since then, the stock has rebounded again, but there’s a saying, you never get hurt locking in profits. I was able to make out with a 60% gain. I’m still watching $BDRY and may initiate a new position on the next pull back, assuming my fundamental drivers are still intact.
Additional Info
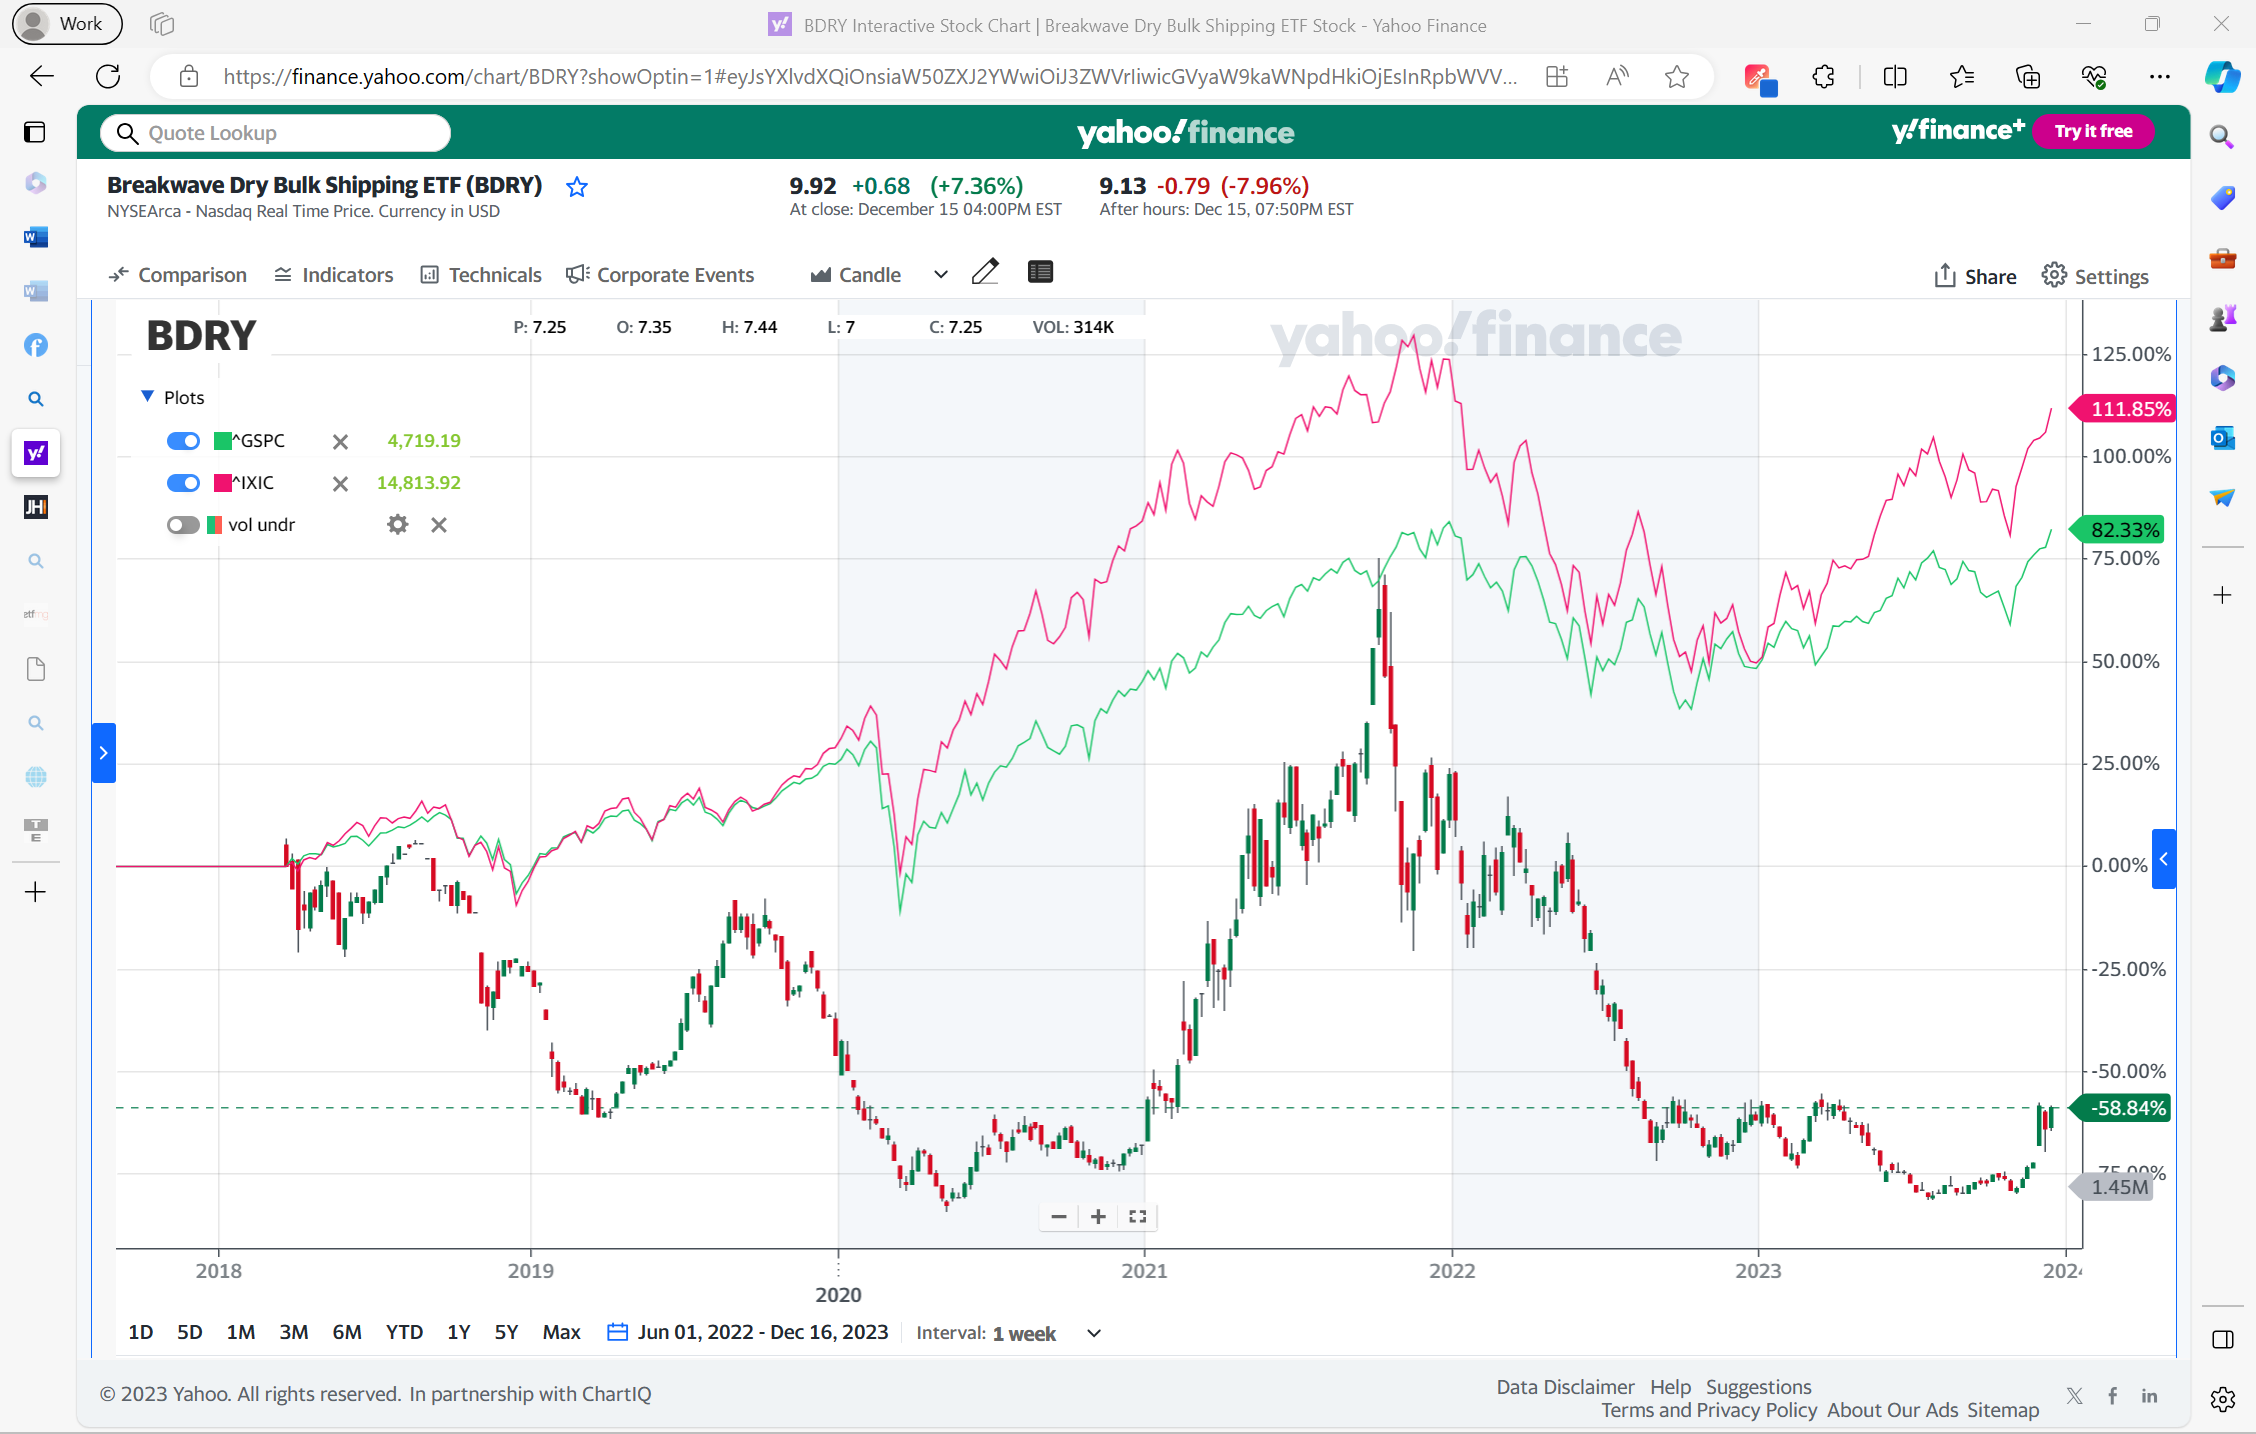
Below is a 5 year chart on $BDRY being compared to the S&P 500 and Nasdaq 100. The green line is S&P 500 & the pink line is Nasdaq. Notice how when there’s a major decline or rally in the major stock indexes. There was the stock rally early in 2023 due to major breakthroughs in AI. notice how a technology boom didn’t come with a rally in global shipping. AI doesn’t need to be transported by sea so there was no rally in $BDRY. This bit of informatoin is just for references and learning purposes. Now you know to check in on shipping rates when the outlook for the global economy is changing.